Water · Drinking-water intakes · Cyanotoxins
The sample is clean.The water is not.
A bloom moves hundreds of metres an hour and changes ninety-three fold in a day. The rule says test it once a fortnight, and allows five days for the answer.
A bloom moves hundreds of metres an hour and changes ninety-three fold in a day. The rule says test it once a fortnight, and allows five days for the answer.
A treatment plant does not decide what is in its raw water. It decides how to treat it, and it decides in advance. The largest of those calls is the pre-oxidant: whether to keep dosing chlorine ahead of filtration, as most plants do most days, on the day a bloom arrives.
Ohio EPA is unusually direct about this. Its treatment optimisation protocol says: Do not apply chlorine ahead of filtration, because any dose of chlorine is expected to lyse cyanobacteria cells.
A cyanobacterial cell is a container. Coagulation and filtration are very good at removing containers, typically ninety-five to ninety-nine percent of them. They do nothing whatever to the toxin once it is out of the cell.
Chlorinate through a bloom and you convert a problem the plant can remove into one it cannot.
The same shape applies to the rest of the day’s settings. Powdered activated carbon runs at three to ten milligrams per litre normally and ten to fifty through an event, which is a different feeder and a different stock position. The intake can be drawn from a different depth if the operator knows the bloom is on the surface. A second source can be brought on where one is consented. Each is decided on a belief about water that has not arrived, hours before any laboratory number exists.
Every lever is set before the evidence arrives, and one of them makes the hazard worse.
the structural problem, in one lineThe intuition most people carry is that a bloom grows. It does, and slowly: WHO puts cyanobacterial populations at two to threefold in two days. That is not the process that beats the sampling programme.
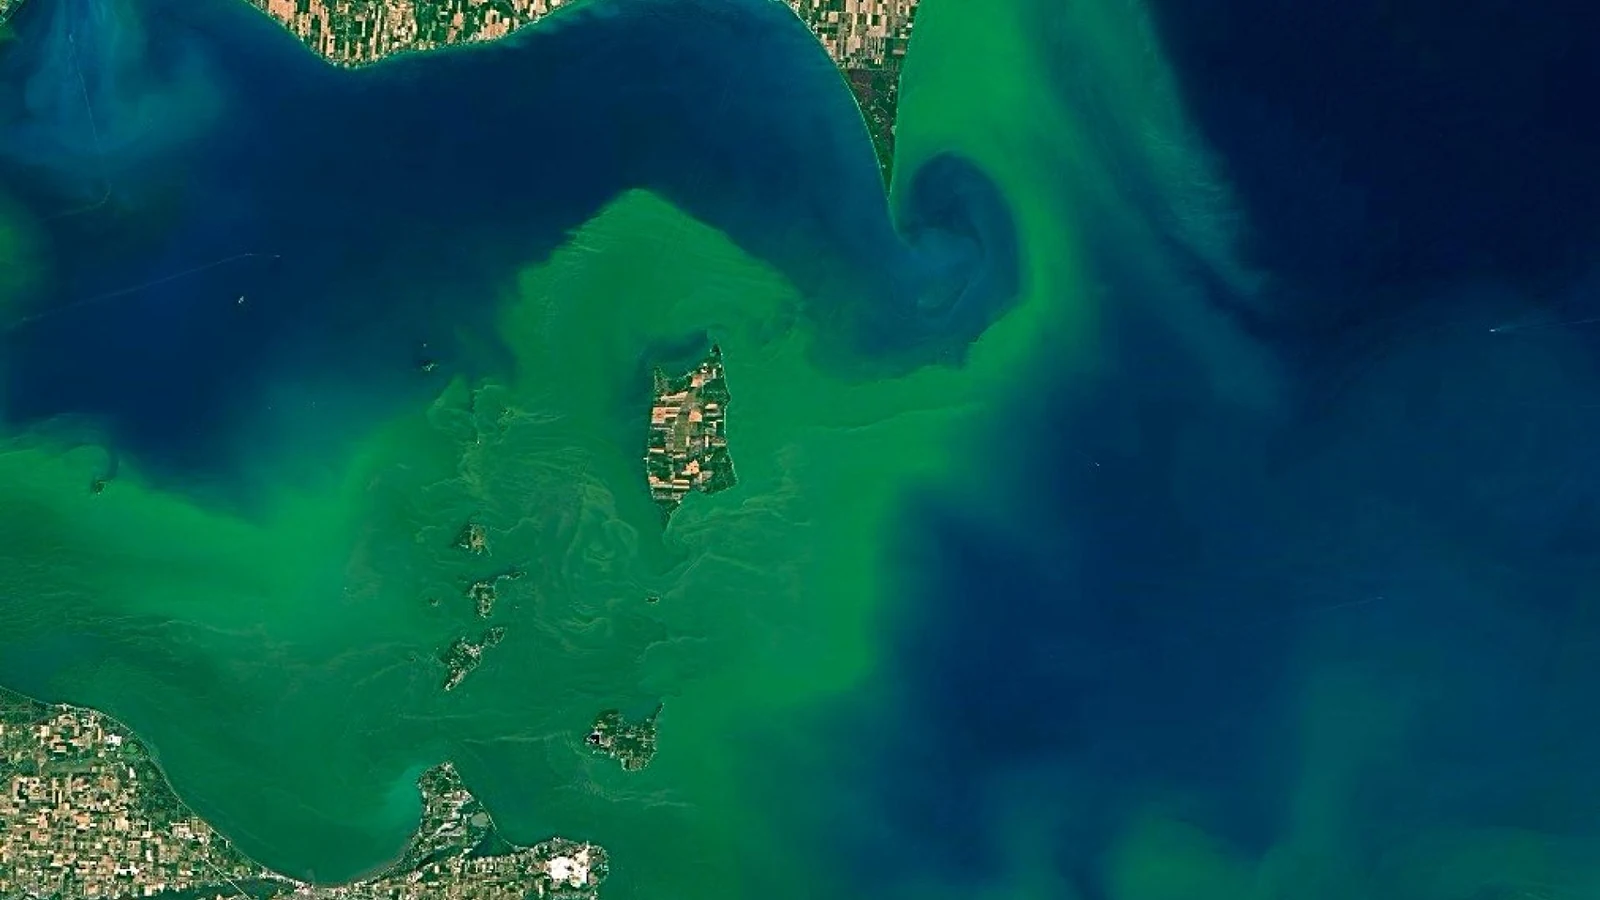
What beats it is movement. Chen and colleagues, working in Lake Taihu, measured that at a light 2.1 metres per second of wind about half the Microcystis biomass in the whole water column gathered into the top centimetre, and that this surface layer travels at roughly one and a half to five percent of wind speed. At a moderate breeze that is several hundred metres an hour. The biomass is not being created. It is being concentrated and carried, and a bloom five kilometres from an intake on Monday can be on top of it on Tuesday.
WHO states the consequence plainly: concentration gradients over depth and area may be very steep and often change rapidly (within less than 1 hour).
Then there is the second invisible state, which is where the toxin is. Inside a cell it is removable by the barrier the plant already has. Outside a cell it is not. Two mechanisms move it across that line without warning. A cyanophage bloom-collapse at Toledo’s own intake released dissolved microcystin over three to four days, which the authors describe as delivering dissolved toxins directly into water treatment utilities.
And partial oxidation does the same on purpose: Greenstein and colleagues found that cells partly oxidised and then left alone kept releasing toxin for more than ninety-six hours after the oxidant was gone, with release in natural bloom samples starting eight to thirty-three hours later.
A cell count does not see dissolved toxin. A dissolved-toxin assay does not see what is still in the cells. The state can cross between the two in an afternoon.
Ohio and Oregon, the two American states with the most developed cyanotoxin rules, both require routine raw-water sampling once every two weeks, and both allow five days from collection to analysis. At a random moment in bloom season the freshest number a plant holds is around ten days old. Toledo, the utility with more scar tissue on this hazard than any other, states on its own page that samples are collected weekly and analysed on a Tuesday. A Thursday breakthrough is measured the following week.
A probe sitting in a full-scale plant intake recorded a ninety-three fold change within twenty-four hours, and a rise from 0.6 to 55.8 units in four. The grab samples were taken between eight and ten in the morning; the peaks were in the afternoon. The authors’ own conclusion is that those peaks were unlikely to be ever measured.
Toledo’s do-not-drink order came roughly a day after the sample that triggered it, for 440,552 people across four counties. The water drunk in that day cannot be recalled, and boiling does not destroy the toxin: it concentrates it. That is why the order was do not drink, not boil.
The rule is not careless. It is a fixed interval applied to a variable that does not hold still, and it was set where the cost of testing is real and the analysis is not the bottleneck. Chromatography for these compounds runs in about thirteen minutes. The five days are logistics.
New Zealand is about to write the same shape of rule. The Drinking Water Quality Assurance Rules 2026, in effect from July 2027, require microscopy weekly for sources assessed as high likelihood and monthly for medium. Taumata Arowai’s own regulation report states that most council surface water sources continue to be assessed as medium or high risk. A medium-likelihood source can therefore be sampled lawfully once a month, against a hazard that moves in hours.
A monthly test against a four-hour event is not a monitoring programme. It is a record.
the rule, stated fairlyAnd the escalation clauses, which are the good part of these rules, all trigger on a number that has already arrived. Ohio requires a twenty-four hour turnaround once an action level is exceeded, and three samples a week at finished-water points after that. Every one of those is the response to a reading, and the reading describes water that is already in the plant.
Knowing three days early is worth nothing if the response has a two-week lead time, so it is worth being precise about what a plant can actually reach for. Ohio again does the arithmetic in public: its general plan guidance recommends keeping two weeks of powdered activated carbon dosed at forty milligrams per litre or better, on site or readily available from the supplier. For a fifty million litre a day plant that is about twenty-eight tonnes, roughly a shipping container, sitting there against a season that may not come.
New Zealand has no equivalent rule. Taumata Arowai regulates detection and response planning. It does not regulate whether a supplier can treat at all.
And the readiness behind that is thin. In the whole published New Zealand record there is one permanent municipal carbon dosing plant, at Ardmore, which supplies around sixty percent of Auckland’s drinking water: two silos, thirty cubic metres, dosing up to four hundred and eighty kilograms an hour, which is on the order of a day at full rate. The Waikato, Hamilton and Te Mārua plants carry carbon in the filter bed instead, which cannot be surged when a bloom arrives.
No New Zealand supplier, utility or regulator publishes a delivery lead time for it.
what we went looking for and did not findThat is not a rhetorical absence, it is the state of the published record after a direct search. The closest figure anyone publishes is an Australian manufacturer’s own wording: in the case of algal taste and odour events, a truck can often be dispatched within two days. Ohio solved this by regulating the stock position. Where that has not been done, the lead time is a live and unmeasured risk, and it sets the useful horizon of any forecast.
The routine programme samples in the morning. The excursion is in the afternoon. Nothing was wrong with the sampling; it was aimed at a variable that had already moved by the time anyone looked.
Three published values from Ma and others (2023), Environmental Monitoring and Assessment 195:1042: 0.6 units at 12:30, 55.8 at 16:30, seasonal mean 1.1, with grab sampling stated as 08:00 to 10:00. Time is to scale. The solid line between the two published points is drawn, not measured, and the dashed part before 12:30 is not measured at all.
In every documented case the breach was found in finished water, after supply, not at the intake.
Microcystin at 3.19 micrograms per litre in drinking water on 1 August. A do-not-drink order for 440,552 residents across four counties, issued on 2 August and lifted on 4 August. Economic loss for the 2014 Lake Erie event put at about sixty-five million US dollars. Toledo has since spent around three million a year on prevention.
Roughly two hundred thousand people served from Detroit Lake. An advisory for vulnerable groups ran from 29 May to 3 July, the governor declared an emergency and the National Guard distributed bulk water. The city then built a fifty million dollar ozone facility. The after-action review found the binding delay was communication, not detection.
A small system on western Lake Erie, and the first do-not-drink advisory issued in the United States for microcystin in finished water. Official presentations reference it repeatedly. None that we could retrieve states the concentration, the population served or the duration, so no figures are given here.
A bloom along 1,100 kilometres of the Murray between March and May, with Microcystis flos-aquae at around 181,000 cells per millilitre and saxitoxins detected in April. The river supplies potable water to towns along its banks. The paper records that the bloom arose suddenly and without warning.
Extensive searching found no New Zealand drinking-water cyanotoxin advisory or exceedance in the public record. New Zealand’s cyanotoxin limits are legally binding maximum acceptable values rather than advisories, most council surface sources are rated medium or high risk, and monthly sampling will be lawful for the medium ones. The exposure here is ahead of us, not behind us. There is no local Toledo to point at, and we will not manufacture one.
Forecast the state at the intake, days ahead. Not whether there is a bloom in the lake, which a satellite already shows, but what arrives at this offtake, at this depth, on this day, given wind, the shape of the water body, where the biomass is now and how this catchment has behaved before.
Optimise the settings that are actually constrained. The pre-oxidant decision first, because it is the one that can make the hazard worse. Then carbon dose against stock and feeder capacity, offtake depth, source switching where a second source is consented, and laboratory and courier capacity, which has to be booked before it is needed.
Score it against the excursion, not the sample. Micrograms per litre entering supply, and days of advisory avoided. Not whether a fortnightly number came back clean.
The pilot is how you find out whether that is worth anything on your catchment. It runs your own past bloom seasons again, uses only the data that existed on each day, and scores the call it would have made against what actually happened in the plant.
We are not claiming to be first. NOAA already runs an operational five-day forecast for western Lake Erie, updated daily through bloom season, including the vertical distribution of buoyant colonies, and has published a method for forecasting toxin concentrations five days out. Toledo has run a phycocyanin sensor reading at fifteen-minute intervals. The honest claim is not that this is unforecast. It is that the only place we found it done is one lake.
We are not claiming a mass-poisoning event. The drinking-water values are ten-day and lifetime health advisories, not acute thresholds. Toledo’s follow-up recorded self-reported gastrointestinal symptoms in 16.2 percent of households and established no confirmed toxin-attributable illness among 440,552 people exposed. The loss that is reliably quantified is economic and reputational, and it is incurred either way.
And we are not claiming that better information is sufficient. In Salem the state of the water was known and the loss happened anyway, because the days between knowing and telling were treated as being inside a ten-day window. A forecast compresses the detection lag. It does nothing to the institutional one, and in the best-documented recent incident the institutional lag was the binding constraint.
Short form. The full working, including what we could not verify, is on Sources and notes.
were unlikely to be ever measured. Every number in the figure. doi.org
Do not apply chlorine ahead of filtration, because any dose of chlorine is expected to lyse cyanobacteria cells; carbon at 3 to 10 mg/L normally and 10 to 50 through an event; drawing the offtake below a surface bloom. Guidance for Public Water Systems Developing a Cyanotoxin General Plan: two weeks of carbon at 40 mg/L on site or readily available.
may be very steep and often change rapidly (within less than 1 hour); the 1 and 12 µg/L guideline values. Toxic Cyanobacteria in Water, 2nd edition, chapters 5, 10 and 11: growth of two to threefold in two days; what each treatment barrier does to cell-bound against dissolved toxin.
well within the 10-day window; the subsequent ozone facility at over 50 million dollars.
collected weekly and analyzed on Tuesday. NOAA Great Lakes Environmental Research Laboratory, Lake Erie HAB Tracker and forecast, for the operational five-day product and its vertical distribution output. University of Toledo, June 2024, for the 15-minute phycocyanin sensor deployment.
cyanotoxins are not destroyed by boiling.US EPA, Cyanobacteria and Cyanotoxins Fact Sheet for Public Water Systems, 2019:
Oxidation often stresses or lyses cyanobacteria cells releasing the cyanotoxin to the water.
A pilot runs your own decisions again across seasons you have already lived, scored against what actually happened at the intake. You already know how those summers went. That is what makes it a test rather than a demonstration.