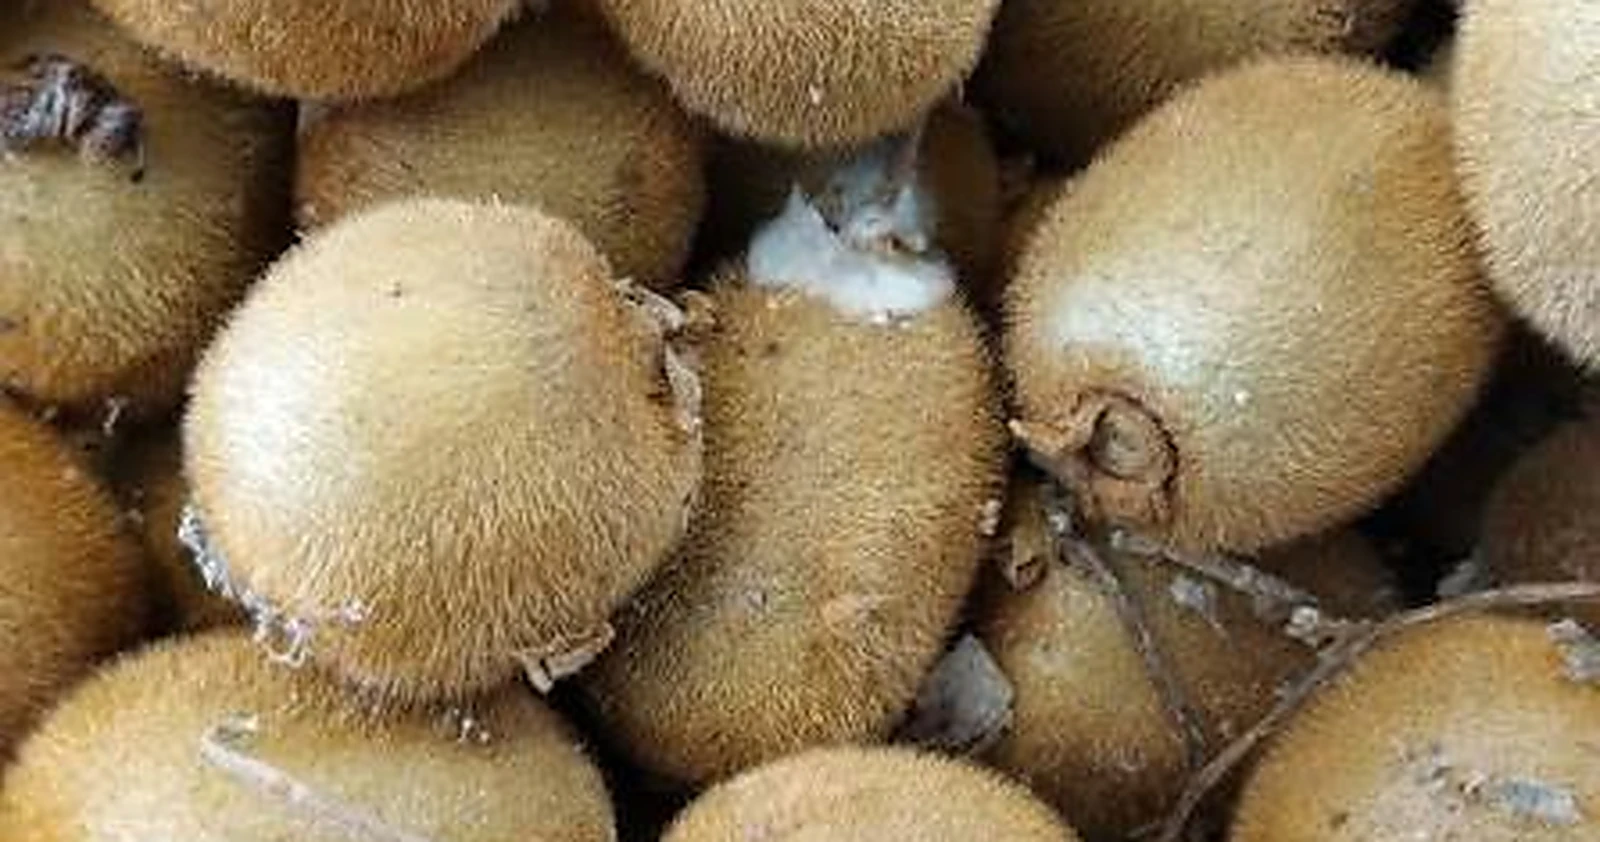
Harvested kiwifruit in bulk, one of them showing white fungal growth
Land · New Zealand kiwifruit · Post-harvest

SunGold’s cost of quality rose $104 million.Green’s fell $25 million. Same season.

Zespri’s 2025/26 Annual Report names causes for both moves. Not one of them carries a number. Cost of quality was around $379 million last season and has ranged from $176 million to $539 million in four years — and we have not found a published measurement of what share of it moves with the grower line.

← The issues One decision, worked all the way down
The decision

Which lines ship now, and which are held for the back of the season.

Half of New Zealand’s kiwifruit is on a vessel within five days of harvest. Zespri improved that this season, from seven days in 2025, and wants it faster still. For that half there is no holding decision at all.

The rest is cooled, held, sometimes repacked, and sold across the following months. Somebody chooses which grower lines go into that second group. The industry has a name for the process and a person who runs it: Load Out Priority, managed by inventory managers inside each packhouse. New Zealand Kiwifruit Growers Incorporated defines it for growers in one line — LOP: Load Out Priority, the order in which what fruit is shipped where — and tells growers to ask their packhouse What influence as a grower do I have over my LOP for the season?, because the usual answer is none.

Interviewed packhouse inventory managers describe the eligibility test for holding fruit as four things: the fruit has no market hold, was harvested at good maturity (so no urgency to loadout), has good fruit quality (historically and in the current season) and its condition checking is looking positive. Three of those four are judgements about the fruit. The parenthetical matters — poor keeping quality creates an obligation to ship early.

So this is not a vacuum. It is an experienced human judgement, made line by line, thousands of times a season, and it is different at every one of multiple post-harvest operators, because each runs its own, and we have not found any of them published, nor an industry standard. In 2022 an industry report recommended creating one: There could be an industry wide standardized LOP or storage rating system to define the storage potential of any fruit. We have found no sign it was built.

Every held line is a bet on how long that fruit has left, placed by a person, on the day, against a number we could not find published.

and the same bet is placed differently at every packhouse
What you can’t see

The defect is defined by an event that has not happened yet.

Follow one line from the orchard. It is picked, and the bins sit to cure — best practice is roughly 24 to 72 hours in a covered, ventilated space, which dries the stem scar and cuts the risk of botrytis later. Then it runs the packing chain, which is where the industry does its sorting. In the industry’s own words, packing is the key control point where the fruit is segregated into market-acceptable product. It is graded for defects, sized, labelled, packed. Quality control staff sample it. It passes.

What the grade cannot catch is damage that has not surfaced. Zespri’s technical manager Frank Bollen put it to growers plainly: Most of the damage is almost impossible to see at the time of packing, but turns into high levels of rots, softs, non-pathogenic fungal growth, and superficial skin rub during storage and shipping. The same briefing recorded fruit dropped onto other fruit or into bins taking five or more days to show damage, so couldn’t be seen during packing.

Five or more days. The grade takes one.

Then the clock starts and never stops. Botrytis, seeded at flowering and entering through the picking wound, surfaces after four to eight weeks in store. Low-temperature breakdown appears after months, and how much of it appears depends on how fast the fruit was cooled and how long it took to reach temperature. Bruising sits under the peel, optically masked. And a single rotting fruit in a tray produces enough ethylene to soften the whole tray.

And the variable most likely to give it away is not in the record that follows the pallet.

The container is not under-instrumented. Its controller logs supply and return air every hour for the whole voyage and holds two years of memory, and Zespri’s guide places a logger on a pallet by the door, deliberately, because that is the warmest air in the box. Temperature is measured, and measured well.

Ethylene is a different matter. The threshold that matters is five to ten parts per billion; at zero degrees sound fruit produces almost none, while one infected fruit does. Onshore the obligation exists — Zespri’s coolstore agreement requires the contractor to monitor ethylene throughout storage. The reefer container controller does not log it. Commercial ethylene monitoring does exist for cold storage and controlled-atmosphere applications; we make no claim about what any vendor offers in transit. What we can say is that the record which crosses the water is a temperature record.

The clock

The consultation is open now.

Clock one
Twenty-two percent, and a decision about it

In July 2026 Zespri opened a discussion with growers about the China market, its largest and highest value. Among the four trends it named: Variability in our quality, particularly late in the season which is impacting customer confidence. In 2025, claims on fruit sold from November reached as high as 22%, more than one in five pieces of fruit failed to meet our standards. Zespri’s own framing of the stakes: Our premium depends on trust.

Clock two
The alternative on the table is not New Zealand fruit

Two options were put to growers. Keep competing from New Zealand, with our response built around improving late-season quality, investing in post-harvest innovation, and developing longer-storing varieties over time. Or a tightly controlled China Supply procurement model under which New Zealand fruit would be sold for as long as it meets the quality and customer expectations required to protect the Zespri premium. If late-season quality falls below that line, Zespri would switch to locally grown Chinese G3.

Read the second option closely, because it contains a forecasting problem stated as a commercial one. Sold for as long as it meets the quality expectations required is a question about how long New Zealand fruit holds the shelf. Answer it well and New Zealand keeps the window. Answer it badly in either direction and you either ship fruit that becomes a claim, or hand a month of the selling window to a competitor already inside it.

The length of the New Zealand selling window is now a forecasting output, not a marketing decision.

And the first option — investing in post-harvest innovation — carries a problem of its own. Sizing that investment means knowing how much of the late-season loss was ever avoidable. We have not found that number published. More on it below.

Before the argument

A great deal is already measured, and Zespri already models quality risk.

Maturity is tested by an independent laboratory before a block can be picked — dry matter, soluble solids, flesh colour, black seed count — and the industry’s own handbook is explicit that the greater the maturity at harvest the greater the taste and storage potential of the fruit. Pallet temperatures are monitored wirelessly through the chain. A Fruit Monitoring Technician rides every chartered reefer from mid-March to mid-June. And in 2024, 22,582 pallets were physically condition-checked, which is 7.5 percent of everything shipped.

Zespri models risk too, and says so. Its June 2026 grower newsletter credits fruit quality risk modelling among the contributors to this season’s result. Since November 2024 a Strategic Product Inventory project specific to Europe has matched quality, clearance and market-access data right down to individual lines to calculate risks such as Softs, Storage Breakdown Disorder, Skin Disorder.

So the honest gap is not measurement, and it is not modelling. It is what the answer is attached to.

Every one of those readings takes the state of the fruit at a moment, on a sample, downstream of the commitment. The Strategic Product Inventory work runs on fruit already in market and sequences what is already there. We have not found anything that returns a number of the form this line, on this route, has an eighty percent chance of still meeting standard on 14 October — produced on the day the line is packed, while the holding decision is still open.

What is open right now

Zespri is making sure a soft fruit is counted the same way in every market. That still will not say what caused it.

Three things are open at once, and all three will close. The industry is writing a longer-term fruit quality strategy with the Industry Advisory Council’s Fruit Quality Steering Committee, and that includes setting shared quality targets. Cost of quality is named in the Five-Year Outlook as a key priority — managing our costs, with a particular focus on managing the cost of quality. And the Annual Report describes planning and implementing a new framework for soft defect analysis to remove variability and inconsistencies in measurement across regions.

That last one matters most, and it is not about us.

If a soft fruit gets counted one way in Rotterdam and another way in Shanghai, then comparing the two markets tells you as much about the counting as it does about the fruit. Zespri knows that and is sorting it out. So this work has to come after theirs, not instead of it — and we would rather it did.

But counting the same way everywhere does not explain why the numbers differ. Once the counts mean the same thing, somebody still has to say what is driving them, and a target set on a number that has not been taken apart is a guess with a decimal point on it.

One caution is worth saying plainly. If you compare markets without first allowing for which fruit went where, you are not really comparing markets. Say Europe tends to get fruit from different regions, picked on different days, held longer before it ships. Then Europe softens more is partly just a statement about what Europe was sent. Telling the journey apart from the fruit can only be done line by line.

The Five-Year Outlook also mentions a Global Soft Fruit Trial which aims to improve our understanding of global variation. We looked for any public description of it — fifteen straight grower newsletters, both Outlooks, the Annual Report, public Canopy, trade press and academic databases — and found none. We do not know what it measures, or at what level. We have not assumed. It is the first thing we would ask about.

And the system that would carry any answer is being designed now. The Annual Report 2025/26 says the largest remaining part of the Horizon programme is New Zealand Onshore Fruit Supply, which is now progressing through solution design and into build, with go-lives targeted ahead of the 2028 season. Alongside it, Zespri is standardising the exchange of core orchard information such as KPINs, block structures and maturity areas, as well as the ability to receive spray and fertiliser application data from service providers. Orchard identity, block geometry and input applications — most of what the research says drives storage variation, and the thing weather attaches to. What gets captured against a grower line is being settled in the next eighteen months.

not verified · said here because we would rather flag a gap than fill it
The rule we have to beat

A human judgement, and one national average.

Two incumbents, and both are better than they look.

The first is Load Out Priority — the inventory manager’s judgement, applied line by line, using maturity, orchard history, current-season quality and condition-check results. It is real expertise and it is doing genuine work. Its limits are the limits of any expert judgement made thousands of times: it is unwritten, it differs at every packhouse, it produces eligible-or-not rather than odds, and no two managers weigh the four criteria the same way.

The second is the fruit loss curve. Time Payments compensate growers for fruit sold late — coolstorage, condition checking, repacking, fruit loss, foregone taste. In 2024 the average rates ran from $1.65 a tray for Class 1 Green to $2.94 for Organic Gold3, across roughly 220 million trays. Zespri’s own Grower Payments booklet describes how the rate is set: from actual industry fruit loss records averaged over a set number of seasons, accumulated and volume-weighted by week, creating the predictive fruit loss curve for the coming season. And then, to every category, a premium is added — the storage incentive — to cover the risk of fruit value or the fruit loss curves used in the calculation of the time rates being different to the actual results at the end of the season.

One curve, built from the industry average, applied to every tray. Plus a blanket premium on top, because the curve is known to diverge from what actually happens.

the gap, stated at its narrowest

Read the second half again. Zespri has written into its own payment system an explicit acknowledgement that the average loss curve does not describe any particular season’s fruit, and has priced that uncertainty as a flat margin spread across everybody.

It is the same failure as ordering stock for every shop against one national size curve. The store-level curves are real and they differ. The average erases them, and then someone adds a safety margin to cover the erasure. The machinery to reward putting the right fruit in the early slot already exists and is already funded. It has no per-line signal to act on.

Twenty years of good work

Everything that could become a rule was adopted. Everything that needed a prediction was not.

New Zealand has been working on this since at least 2003, and the work is good. Massey doctoral theses in 2003, 2014 and 2017; published papers in 2013 and 2022; a Plant & Food Research post-harvest programme funded by Zespri. We have not found any of it in commercial use.

That is not because the industry ignores research. Look at what was adopted. Curing fruit for 24 to 72 hours before cooling — standard practice. Keeping vine canopies open so botrytis cannot build up in dead leaves — adopted, and it largely solved a storage rot problem that was costing the industry around ten million dollars a year. Minimum dry matter and brix before picking is permitted — independently laboratory-tested and enforced on every block.

Every one of those is the same instruction for everybody. Every one of them worked.

Now look at what did not get adopted. This line will last until October; that one will not. That is not a rule. It is a different answer for every line, every time, and there is no way to write it into a standard, train a workforce on it, or audit compliance with it. It has no institutional home, so it stayed in the journals.

And there is a consequence that is easy to miss. Every rule the industry adopted removed the part of the loss that responds to a uniform fix. What is left is, by construction, the part that does not. So the share of remaining loss that needs a per-line answer rises every time the industry succeeds — even as total loss falls. This is worth more now than it was in 1990, not because anyone got worse, but because they got good.

And the research had three handicaps we would not have

It had to sample. Between 27 and 108 grower lines, over one or two seasons, using an instrument bought for the study. You cannot put a spectrometer on a national crop, so the studies were small by necessity.

It measured a stand-in for the outcome. Every study predicted laboratory penetrometer firmness after controlled storage — in the most recent case, with ethylene held below 5 nL/L for the whole experiment, which is to say with one of the biggest real-world causes of failure deliberately switched off. We have not found a model fitted to a commercial outcome.

And the season moved underneath it. A segregation rule calibrated in one New Zealand season correctly categorised 60 percent of lines that year and 53 percent the next, against a 33 percent chance baseline. Underneath that, the share of genuinely poor-storing lines swung from 35 percent to 53 percent between two consecutive seasons. That is a season effect large enough to swamp a line effect in any single year.

The result is a consistent asymmetry across every attempt: the models identify good fruit at around 78 to 80 percent, and miss roughly half the bad. Bad fruit is the only fruit that costs money. That, in one sentence, is why the work sits on a shelf, and the authors say so themselves — the level of accuracy achieved was not adequate for online sorting purposes.

Note what they blame. Many pre-harvest factors contribute to variation in fruit quality at harvest and during coolstorage, resulting in the difficulty in segregating fruit for their storage potential. Pre-harvest heterogeneity, and not being able to read the signal precisely enough. Not one of them says the outcome is decided after packing.

The figure

Two lines that should track each other, and do not.

Kiwifruit · the shape of the decision
SHARE OF FRUIT FAILING TO MEET STANDARD · SELLING WINDOW KIWISTART MAINPACK · MAY FROM NOVEMBER WHAT THE PACKLINE COULD SEE ON THE DAY VISIBLE DEFECTS, GRADED OUT WHAT ACTUALLY FAILED, LATER THE GAP IS FRUIT THAT PASSED THE GRADE 22% · ZESPRI, 2025 MORE THAN ONE IN FIVE WEEK 0 6 12 18 24 30 WEEKS AFTER PACKING AND THE SAME TRAY FACES A DIFFERENT CLOCK DEPENDING ON THE LANE IT IS GIVEN REEFER · DIRECT TO JAPAN, CHINA, KOREA, EUROPE 2–4 WEEKS AT SEA CONTAINER LINER · MULTI-PORT LONGER, AND VARIABLE HELD ONSHORE, THEN SHIPPED COOLSTORE OR CA, THEN THE VOYAGE THE ASSIGNMENT IS MADE ON CLASS, VARIETY, GROWING METHOD AND SIZE. NONE OF THOSE IS HOW LONG THE FRUIT WILL LAST.
Scroll the figure →

The dotted line is what the packline can see and reject: visible defects, roughly constant across the season, because the grading standard does not change. The solid line is the share that fails somewhere later. The two diverge because they are measuring different things. One is a state today, the other is an event in the future. The single marked point is not schematic: it is Zespri’s own figure for claims on fruit sold from November 2025. Underneath, the three lanes a tray can be assigned to, which differ by weeks. The allocation is made on class, variety, growing method and size, and the cost of holding is priced off a single industry-average curve. None of those is how long a particular line will last.

The two curves are schematic and illustrate the divergence, not a measured series. The 22 percent point, the lane types and their transit durations, and the basis of the Sales Forecast are all sourced below.

The unit

The grower line, and its spread — not the tray, and not the mean.

Estimate at the finest unit where signal-to-noise supports estimation. Then check that a decision is actually made at that unit. If the two do not coincide, you have a research project or a feature, not a product.

The published evidence draws that line precisely. When Massey researchers segregated 27 commercial ‘Hayward’ grower lines at harvest using full visible and near-infrared spectra, classification of the individual fruit that would go soft reached about 54 percent sensitivity in calibration and 32 percent on a new season. But segregating between grower lines cut soft fruit by 30.7 percent, from 25.1 percent to 17.4 percent.

And the size of the difference between lines is not marginal. Across those 27 commercial lines, soft fruit ranged from about 2 percent in the best line to about 64 percent in the worst. A thirty-fold spread, from fruit that all passed the same grade.

The signal survived aggregation to the line and did not survive at the fruit. A grower line is a real physical object — one orchard, one harvest date, one packrun, one shared handling and cooling history — which is why noise averages inside it. It is also the unit at which fruit is actually held and sequenced.

But the line’s average is the wrong summary of it.

Two results say the same thing from opposite directions. A 1999 New Zealand study found that when firmness was determined prior to shipping, no device discriminated between orchards for subsequent softening — and then that softening was predicted by the high between fruit variability in the firmness of a 20 fruit sample. The spread, not the mean. And work on variance propagation in post-harvest systems showed that fruit-to-fruit variation inside a batch is not noise but a distribution that moves forward predictably, reaching an adjusted R² of 0.96 in tomato from nothing but the spread of colour at harvest.

So the question to ask of a line is not will it fail. It is what fraction of it will fail, and by when. Anything that summarises a line by its average dry matter has thrown the predictive part away before it starts.

Ross Ashby put the general form of this in 1956: every good regulator of a system must be a model of that system. The regulator has to match the variety of what it regulates — no coarser, and no finer.

What we would do first

How much of the loss was decided before packing?

We went looking for a published answer specifically — variance components, random effects, intraclass correlation — and checked the four New Zealand theses that would carry it. We did not find one, for kiwifruit or for any other fruit export chain we searched. We may have missed it, and if the work exists inside Zespri we would rather build on it than repeat it.

That is the number the whole question turns on. How much of the final outcome is attributable to the grower line, how much to the season, how much to the route and the handling, and how much is simply irreducible.

The table this question is about
COST OF QUALITY, NZD MILLIONS 2022 2023 2024 2025
Zespri SunGold$357.6$140.7$176.2$280.3
Zespri Green$159.4$29.5$108.4$83.4
Zespri Organic SunGold$11.0$3.1$3.6$7.0
Zespri Organic Green$10.8$2.6$5.3$4.7
Zespri RubyRed$0.2$0.4$1.3$3.9
Zespri Sweet Green$0.4$0.1$0.1$0.1
Total — our sum, not Zespri’s$539.4$176.4$294.9$379.4

Zespri Annual Report 2025/26, Cost of Quality by pool. Prior years restated by Zespri at 2025/26 seven-year average FX, so the seasons compare like for like. The pool rows are Zespri’s; the total row is ours. Per tray, SunGold moved $1.41 to $1.99 while Green moved $1.81 to $1.31 — so in 2024 Green was the dearer of the two to keep in good condition, and in 2025 it was SunGold. They swapped places. What sits inside the cost-of-quality line is not disclosed, so we do not know how much of it is avoidable.

Two things follow, and it is worth being careful about which. Neither variety is simply the harder one to keep — if Green were the more fragile fruit it would cost more every year, and it does not. And the two moved in opposite directions in the same season, having grown in the same country, in the same season, moved through the same shipping system and been sold in the same currency. Anything that hit the whole industry at once — a poor spring, a labour shortage, a freight spike, a congested port, the exchange rate — should have pushed both the same way. It did not.

What that does not do is say what the cause was. It says only that it was not something that hit everything equally. It could be something that hit SunGold’s markets and not Green’s — SunGold carries far more of the China exposure, and softer Chinese conditions is one of the four causes Zespri names. Or it could sit further back, in which fruit was picked when, and where each lot was sent. Those are four different answers with four different price tags, and nothing published separates them. That is the work this page is about.

One objection worth settling early. SunGold sells for more than Green, and part of cost of quality scales with what the fruit is worth — lost fruit, claims credited at arrived sound market value, discounts. So is the gap just a price effect? Taking price out makes it sharper, not softer. Cost of quality per tray, set against average orchard gate return per tray, across four seasons:

SEASON SUNGOLD OF OGR GREEN OF OGR HIGHER SHARE
2022/23$3.4634.7%$2.5944.8%Green
2023/24$1.5512.0%$0.747.7%SunGold
2024/25$1.4111.9%$1.8121.7%Green
2025/26$1.9916.7%$1.3112.7%SunGold

From our reading of Zespri’s published material it appears the answer alternates every season. That is worth checking, because it is ours rather than theirs: the cost figures and the returns are Zespri’s, the division is ours. If it holds, no fixed property of either variety explains a ranking that swaps four times in four years — and it still swaps three times in three if the disrupted 2022/23 season is set aside. These four are the whole published record: cost of quality by pool does not appear in the earlier Annual Reports. The dollar totals are mostly volume in any case — the cost figures imply roughly 141 million SunGold trays against 64 million Green, which is our arithmetic rather than a published Zespri volume — which is why this runs on the per-tray line and not on $280 million against $83 million.

If most of the variation sits at the line, the average loss curve is leaving money on the table. If most of it sits in the season or the handling, it is not — and that is worth knowing before anyone invests in post-harvest innovation.

either answer is worth having, and neither exists today

Producing it is not a model. It is a measurement, and it is the honest first piece of work. It also settles whether the second piece — a per-line forecast conditioned on the route, and an optimiser that assigns lines to the coolstore, controlled-atmosphere and sailing capacity that actually exists — is worth building at all.

Telling the fruit apart from its journey

Lines are not sent to markets at random. Somebody chooses, and they choose on what they know — fruit expected to hold well probably gets the long route, or gets held longer. That tangles up the effect of the line with the effect of the journey, and makes one look bigger than it is at the other’s expense. It is the same problem doctors have when a treatment was not handed out at random: the sicker patients got the stronger drug, so the drug looks worse than it is.

What pulls the two apart is overlap. The same line split across several destinations, and the same route carrying many lines. Where there is plenty of overlap the two effects can be told apart; where there is little, they cannot, and the honest answer there is a wide range rather than a single number. Finding out how much overlap actually exists is part of the first piece of work — and it is one of two reasons the study needs every line in its slice rather than a sample of them.

The other obstacle, stated honestly

The outcome has to reach back to the line, and the chain is not clean. Fruit mixes on the packline and again at repack. New Zealand research published in 2007 established that grower-to-pack traceability through a packhouse is probabilistic, not deterministic, and built the measures for it — precision of traceability, packs per bin for tracking, bins per pack for tracing. That work named the two applications it would enable: feedback to growers on measured quality and feedback to the market on predicted quality. We have found no sign it was finished.

Nor does the commercial outcome come back down the same thread. A quality claim, in Zespri’s own Pool Policy Manual, is credit issued to customer following assessment and acceptance of a formal quality claim, valued for offshore losses at ‘Arrived Sound Market Value’ applicable to the Zespri variety at the week of arrival, and for onshore insured losses at forecast FOBS value at the time of loss. It is then allocated by way of the material master code to the actual pool of sale — which is how a claim reaches a pool, not how it reaches a grower. Variety. Week. Consignment. Pool. It is a finance record, and it was never built to point at a packed line.

Attributing one claim to one line is probably impossible. It is also not necessary.

Where enough lines appear across enough overlapping deliveries, line effects can be recovered without ever knowing which tray failed. That is what needs the mathematics, and it is precisely why the work needs every line within its scope rather than a sample of them. A study with 27 lines needs a clean join or it has nothing. A study with thousands does not.

Four things we are not claiming

That the industry has a quality crisis. It does not. SunGold’s cost of quality fell to $1.40 a tray in 2024. Green’s went from $0.75 to $1.80 in the same year and Green conventional claims nearly tripled to 3.8 percent. The argument is about the variance and the back of the season, not the average.

That Zespri does not already measure or model this. They do, and the section above says so in their own words. Our question is a different one: how much of the loss is attributable to what.

That we understand the fruit better than Plant & Food Research or Massey. We do not, and we would be learning from them. What we bring is the mathematics — hierarchical forecasting under uncertainty, and constrained optimisation. A forecast alone does not survive a season effect that swings the population of poor-storing lines from 35 to 53 percent. What absorbs that is the ability to re-solve the assignment as the season reveals itself, and we have not found a published attempt at that half of the problem here.

Any figure for claims volume or value. Numbers circulate for the count and cost of customer claims; the 22 percent is Zespri’s own, published to growers, and is the only claims figure on this page.

Sources
  • Zespri Group Limited. Annual Report 2025/26 (year ended 31 March 2026). Cost of Quality by pool for 2022–2025, with prior years restated by Zespri at 2025/26 seven-year average FX so the seasons compare like for like. Stated causes for both movements: Green improved on harvest timing and maturity management; SunGold was driven in part by elevated inventory levels and slower mid-season run rates due to softer economic conditions in China and late-season fruit quality challenges in some markets. Also planning and implementing a new framework for soft defect analysis to remove variability and inconsistencies in measurement across regions; work with the Industry Advisory Council’s Fruit Quality Steering Committee on an industry-led strategy setting shared quality targets; product audits up 19 percent and container ECPI inspections up 64 percent, approximately 55,000 pallets overall; 215 million trays of New Zealand-grown fruit – an increase of approximately 12 percent; and Zespri has strengthened its capability to undertake strategic network modelling and optimisation. Average OGR per tray across 2022/23 to 2025/26, from the Annual Reports for 2023/24, 2024/25 and 2025/26. SunGold $9.97, $12.92, $11.81, $11.90. Green $5.78, $9.55, $8.36, $10.28. The 2024/25 report labels its columns by season, which is how we know the single-year labels in the newer charts mean the first year of each season pair, and therefore how the cost-of-quality columns line up with the returns. The full published run is longer than four seasons for returns — Green back to $5.23 in 2013/14, SunGold to $12.91 — but not for cost of quality, which appears by pool only in the 2025/26 report. The most recent values come off a chart, so we checked them a second way: Zespri states Green’s OGR per hectare rose 32 percent, $89,783 to $118,790, and our per-tray figures imply a 7.6 percent yield rise, which compounds to 32.4 percent. The same check on SunGold gives 8.6 percent against a published 8.6 percent. Not verified: whether cost of quality is deducted before orchard gate return is struck. If it is, the shares of gross value for 2024/25 and 2025/26 are 10.7 and 14.3 percent for SunGold against 17.8 and 11.3 for Green — the comparison runs the same way either way, which is all our argument rests on. Other 2025/26 returns per tray: Organic SunGold $16.14, Organic Green $13.72, RubyRed $16.01, Sweet Green $9.93. The four annual totals quoted on this page are our sum of Zespri’s six pool rows, not a Zespri figure. canopy.zespri.com
  • Zespri Group Limited. Five-Year Outlook 2025/26. Key Priorities: managing our costs, with a particular focus on managing the cost of quality. Challenges and Risks: The quality strategy review is currently underway… supported by the Global Soft Fruit Trial, which aims to improve our understanding of global variation and enhance market-specific outcomes. Not verified: we could find no public description of the Global Soft Fruit Trial anywhere — not in Kiwiflier issues 470 to 484, the 2024 Outlook, the Annual Report, public Canopy, trade press or academic databases. Supply and demand: New Zealand SunGold 139.5m trays in 2025/26 rising to 163.5m by 2030; ZGS SunGold to 60m by 2035 against 102m of northern-hemisphere target demand, with Zespri forecasting to meet 60 percent of target demand in the 2035/6 counter-season. zespri.com
  • Zespri Group Limited. Annual Report 2022/23. On the disrupted season: quality costs estimated at ~$530 million in 2022/23, driven by the season’s labour shortage and poorer quality harvest — which independently confirms our $539.4m sum for that year, the difference being Zespri’s later FX restatement. And on what the number represents: The scale of these quality costs offers an indication of the size of the value in front… That framing is Zespri’s, not ours. We keep 2022/23 in the table because it shows what a genuinely industry-wide shock looks like here — both pools going to extreme levels together, which is exactly what the three later seasons do not do. zespri.com
  • Zespri Group Limited. Annual Report 2024/25. Work continues on understanding the drivers of higher levels of soft fruit in Europe and a higher proportion of skin disorders in fruit in Asia, alongside the introduction of a Soft Fruit Tester in Europe. This is the only public sign we found of the level at which Zespri frames the variation question, and it is market-level rather than line-level. zespri.com
  • Zespri. Kiwiflier 484, July 2026. The China discussion document: the four trends, the 22 percent claims figure on fruit sold from November 2025, our premium depends on trust, and the two options put to growers. zespri.com
  • Zespri. Kiwiflier 483, June 2026. The pick-pack-ship model, fruit quality risk modelling, offshore quality assurance and inventory management processes all contributed to the positive outcome. canopy.zespri.com
  • Zespri. Kiwiflier 482, May 2026. 50 percent of fruit shipped five days from harvest, compared to seven days in 2025. zespri.com
  • Zespri. Kiwiflier 464, November 2024. The Strategic Product Inventory project for Europe, matching quality, clearance and market access data right down to individual lines; and the largest-ever volume of SunGold held in controlled atmosphere. zespri.com
  • Zespri. Kiwiflier 444, February 2023, “Quality Action Plan Update”. Frank Bollen, Zespri Technical Manager, on damage almost impossible to see at the time of packing and impact damage taking five or more days to show damage. zespri.com
  • Zespri. Grower Payments 2026. Fruit loss compensation based on actual industry fruit loss records averaged over a set number of seasons… creating the predictive fruit loss curve for the coming season; the storage incentive premium added for all categories; and the published figures for average Time Payments paid — $1.65 to $2.94 across pools in 2024, shown in the same chart as a February 2025 forecast spread of $1.51 to $2.18. These are averages actually paid, not a rate card; the rates themselves sit on Canopy. The unit is not verified: the axis is unlabelled and the booklet uses tray equivalent elsewhere. Only the fruit-loss part of the rate supports the argument on this page, and that is all we use it for. zespri.com
  • Zespri Group Limited. Pool Policy Manual, February 2026. The definition of a quality claim as credit issued to customer following assessment and acceptance; valuation at ‘Arrived Sound Market Value’ applicable to the Zespri variety at the week of arrival; and allocation by way of the material master code to the actual pool of sale. zespri.com
  • New Zealand Kiwifruit Growers Incorporated. Post-harvest Transparency Questions, 2025. The glossary definition LOP: Load Out Priority, the order in which what fruit is shipped where; Post-harvest operators will manage a LOP process, the process that decides what fruit goes where and when; and Post-harvest operators may employ varying load-out and inventory management strategies across different pools. nzkgi.org.nz
  • Jabbar, A. Predicaments Around Storage Pooling in the Kiwifruit Industry. Kellogg Rural Leadership Programme, Course 47, 2022. Interviewed packhouse inventory managers on the four-part eligibility test for long-term storage, and the recommendation for an industry wide standardized LOP or storage rating system. Nine interviews; the author records support from Zespri International. ruralleaders.co.nz
  • New Zealand Kiwifruit Growers Incorporated. Kiwifruit Book, chapter six. Curing at 24–72 hours; packing as the key control point where the fruit is segregated into market-acceptable product; controlled-atmosphere storage; the Fruit Monitoring Technician aboard each reefer; maturity and storage potential. nzkgi.org.nz
  • New Zealand Kiwifruit Growers Incorporated. Kiwifruit Industry Performance Report 2025. At 22,582 pallets checked, this was 7.5% of all pallets shipped; cost of quality per tray by variety, SunGold $1.40 in 2024 against $1.55 in 2023, and Green $0.75 in 2023 against $1.80 in 2024 — these sit a cent away from Zespri’s own Annual Report figures of $1.41 and $1.81, and we use Zespri’s; Green conventional claims nearly triple that of 2023. nzkgi.org.nz
  • Li, M., Pullanagari, R., Yule, I. & East, A. “Segregation of ‘Hayward’ kiwifruit for storage potential using Vis-NIR spectroscopy.” Postharvest Biology and Technology 189:111893, 2022. 27 commercial grower lines, 90 fruit each, stored 125 days at 0 °C, with soft defined as flesh firmness below 9.8 N; soft fruit ran from 2.2 to 64.4 percent between lines; segregation on Vis-NIR spectra taken at harvest, The proportion of soft fruit reduced by 30.7% from 25.1%… to 17.4% — a relative reduction, not 30.7 percentage points; on the unseen 2015 season the model found 196 of 610 soft fruit, a true-positive rate of 32.1 percent with 77.9 percent of sound fruit passed, against about 54 percent in in-sample cross-validation on 2012–13 data; coolstore ethylene monitored and maintained below 5 nL L−1, with no rationale given in the paper; the proportion of soft fruit reduced by 30.7% from 25.1%… to 17.4%; external validation true-positive rate of 32.1 percent on the soft class; fruit stored at 0 °C with ethylene maintained below 5 nL L−1. mro.massey.ac.nz
  • Jabbar, A. Accelerated fruit libraries to predict storage potential of ‘Hayward’ kiwifruit grower lines. PhD thesis, Massey University, 2014. 60% of grower lines were successfully categorised into low, medium or high storage potential in the calibration season, and only 53% on validation the following season — three-class sorting of lines, where chance is about 33 percent, and not a soft-fruit detection rate. The share of low-storing lines was 35 percent of the population in the first season and 53 percent in the second; that season two’s accuracy and its prevalence are both 53 percent is a coincidence of two unrelated quantities. This work ran across three seasons, with a preliminary season of roughly 20 lines; the proportion of low-storing lines moving from 35 to 53 percent between seasons. mro.massey.ac.nz
  • Li, M. PhD thesis, Massey University, 2017. The level of accuracy achieved was not adequate for online sorting purposes. mro.massey.ac.nz
  • Feng, J. Segregation of ‘Hayward’ kiwifruit for storage potential. PhD thesis, Massey University, 2003. 108 grower lines over two years; over 50 percent correctly classified against a 25 percent chance criterion; and the finding that the effect of pre-storage delay depends on the line’s starting condition. mro.massey.ac.nz
  • Burdon, J., Lallu, N., Wiklund, C., McLeod, D. & Davy, M. “Discrimination and prediction of softening in Hayward kiwifruit.” Acta Horticulturae 498:217–224, 1999. When firmness was determined prior to shipping, no device discriminated between orchards for subsequent softening… softening was predicted by the high between fruit variability in the firmness of a 20 fruit sample. ishs.org
  • Hertog, M., Lammerteyn, J., Desmet, M., Scheerlinck, N. & Nicolaï, B. “Incorporating biological variation in postharvest modelling.” Acta Horticulturae 682:843–850, 2005. Prediction of the propagation of biological variation at an adjusted R² of 0.96 based on just the initial colour distribution measured at harvest. ishs.org
  • Bollen, A.F., Riden, C.P. & Cox, N.R. “Agricultural supply system traceability, Part I: Role of packing procedures and effects of fruit mixing.” Biosystems Engineering 98(4):391–400, 2007; and Riden & Bollen, Part II, 98(4):401–410. Packhouse traceability as a probabilistic rather than deterministic property; the measures precision of traceability, packs per bin for tracking and bins per pack for tracing. doi.org
  • Manning, M.A., Pak, H.A. & Beresford, R.M. “Non-fungicidal control of Botrytis storage rot in New Zealand kiwifruit through pre- and postharvest crop management.” In Postharvest Pathology, Springer, 2009, 183–196. Storage rot costing the industry about NZ$10 million per year; symptoms developing after 4–8 weeks; and the botrytis problem has largely been solved by vine management that avoids dense leaf canopies. link.springer.com
  • Lallu, N. “Low temperature breakdown in kiwifruit.” Acta Horticulturae 444:579–586, 1997. Cooling rate and time to reach storage temperature after precooling as significant determinants of breakdown incidence. ishs.org
  • Hertog, M., Uysal, I., McCarthy, U., Verlinden, B. & Nicolaï, B. “Shelf life modelling for first-expired-first-out warehouse management.” Philosophical Transactions of the Royal Society A 372:20130306, 2014. FEFO will only ship products depending on their shelf life potential in relation to their end destination. pmc.ncbi.nlm.nih.gov
  • University of California, Davis. Postharvest Technology produce facts, kiwifruit. As little as 5-10 ppb ethylene will induce fruit softening. postharvest.ucdavis.edu

Figures are quoted as published and are not combined, ratioed or extrapolated, with one exception, labelled where it appears: the four annual cost-of-quality totals are our sum of Zespri’s six published pool rows. Where a source was read only as an abstract rather than in full, the claim drawn from it is limited to what the abstract states. Where we have found nothing, this page says so.

Three figures on this page are easy to misread, so we say it plainly. The 30.7 percent reduction in soft fruit reported by Li et al. is a relative reduction — 25.1 percent down to 17.4 — not 30.7 percentage points. Two accuracy figures circulate for that same study: about 54 percent is in-sample cross-validation, while 32.1 percent is the rate on a season the model had never seen. We quote the second. And the 60 and 53 percent from Jabbar are three-class sorting of grower lines into low, medium and high storage potential, where chance alone gets about 33 percent — they are not soft-fruit detection rates.

Every figure on this page was re-checked against its original source on 1 August 2026, rather than against our own earlier drafts. Several claims that had survived a number of revisions did not survive that check, and have been corrected or removed.
Start here

Measure it before you model it.

Before anyone builds a forecast, somebody has to measure how much of the loss was ever predictable. We have not found it done. It is a decomposition, not a model, and it settles whether the model is worth building.

Scoping is free and it is mostly questions: who holds which piece, where it sits, and whether an outcome can reach back to a packed line at all. Everything from the first data extract onwards is fixed fee, agreed before it starts. If the answer is that the loss was mostly season and handling, that is the answer, and we report it.